
Click here for a higher resolution picture of the map.
This is CDC data for assault homicide deaths in 2022. Note that CDC assault homicide death tolls tend to be slightly higher than official murder/nonnegligent manslaughter deaths published by police departments or state governments. This is, in fact, because the CDC is more lenient about what they count. In contrast, cities and states are motivated to make their official number as low as possible. Most states were counting homicides in their official totals decades ago that would not be counted today.
For 2022, the FBI reports 19,200 homicide victims, with 83.3% of law enforcement agencies supplying data. The CDC reports a total of 24,835 assault homicide deaths nationwide. However, their 2022 data is still listed as “provisional,” and more could still be added to the list.
Also, note that the CDC will not publish individual numbers of deaths less than 10 in the 2022 data. So anything less than 10 is a “statistical zero.” and deemed unfit for extrapolating data. So there is no data for twelve states. However, it is safe to assume that all of these numbers would be very low.
|
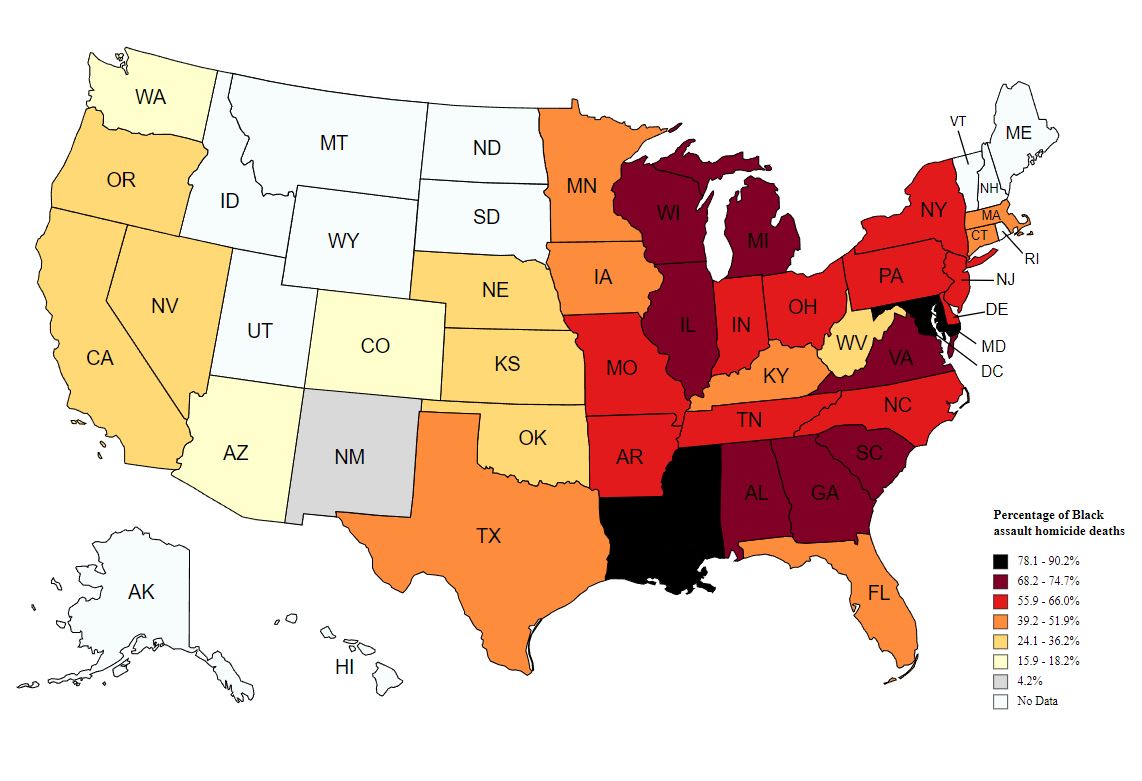
Assault Homicide Deaths for 2022 according to the CDC
|
|||
| Total Deaths | Black Deaths | Black % | |
| Alabama (01) | 702 | 502 | 71.5% |
| Arizona (04) | 635 | 101 | 15.9% |
| Arkansas (05) | 325 | 194 | 59.7% |
| California (06) | 2,289 | 642 | 28.0% |
| Colorado (08) | 423 | 77 | 18.2% |
| Connecticut (09) | 149 | 69 | 46.3% |
| Delaware (10) | 59 | 33 | 55.9% |
| District of Columbia (11) | 235 | 212 | 90.2% |
| Florida (12) | 1,495 | 771 | 51.6% |
| Georgia (13) | 1,228 | 917 | 74.7% |
| Illinois (17) | 1,280 | 897 | 70.1% |
| Indiana (18) | 559 | 324 | 58.0% |
| Iowa (19) | 90 | 41 | 45.6% |
| Kansas (20) | 175 | 51 | 29.1% |
| Kentucky (21) | 349 | 181 | 51.9% |
| Louisiana (22) | 860 | 690 | 80.2% |
| Maryland (24) | 608 | 500 | 82.2% |
| Massachusetts (25) | 159 | 67 | 42.1% |
| Michigan (26) | 786 | 536 | 68.2% |
| Minnesota (27) | 210 | 106 | 50.5% |
| Mississippi (28) | 553 | 432 | 78.1% |
| Missouri (29) | 756 | 499 | 66.0% |
| Nebraska (31) | 69 | 25 | 36.2% |
| Nevada (32) | 252 | 81 | 32.1% |
| New Jersey (34) | 312 | 188 | 60.3% |
| New Mexico (35) | 296 | 12 | 4.1% |
| New York (36) | 838 | 469 | 56.0% |
| North Carolina (37) | 936 | 586 | 62.6% |
| Ohio (39) | 923 | 606 | 65.7% |
| Oklahoma (40) | 323 | 82 | 25.4% |
| Oregon (41) | 218 | 54 | 24.8% |
| Pennsylvania (42) | 1,069 | 668 | 62.5% |
| South Carolina (45) | 584 | 410 | 70.2% |
| Tennessee (47) | 768 | 482 | 62.8% |
| Texas (48) | 2,310 | 906 | 39.2% |
| Virginia (51) | 638 | 437 | 68.5% |
| Washington (53) | 419 | 74 | 17.7% |
| West Virginia (54) | 116 | 28 | 24.1% |
| Wisconsin (55) | 334 | 233 | 69.8% |


Be the first to comment