
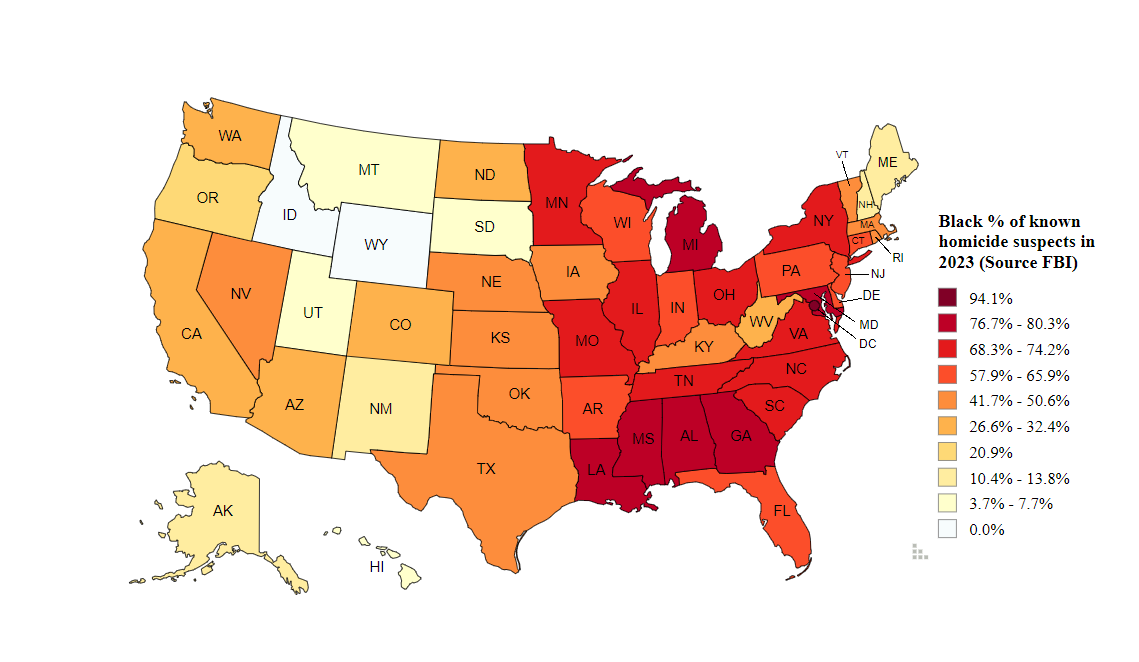
The Black percentage of known homicide suspects, by state, as reported in the FBI’s 2023 expanded homicide data.
Click here to view larger image of the map.
| Black Suspect % | % Population Covered | Overall Black % |
Black Overrepresentation
|
|
| Alabama | 79.0% | 88.1% | 26.8% | 10.3 |
| Alaska | 13.7% | 99.3% | 3.7% | 4.1 |
| Arizona | 29.0% | 86.4% | 5.5% | 7.0 |
| Arkansas | 65.7% | 95.3% | 15.6% | 10.4 |
| California | 27.7% | 96.0% | 6.5% | 5.5 |
| Colorado | 32.4% | 95.2% | 4.7% | 9.7 |
| Connecticut | 59.6% | 100.0% | 12.9% | 10.0 |
| Delaware | 65.9% | 100.0% | 23.8% | 6.2 |
| DC | 94.1% | 100.0% | 47.2% | 17.8 |
| Florida | 57.9% | 58.3% | 17.0% | 6.7 |
| Georgia | 80.3% | 79.0% | 33.1% | 8.2 |
| Hawaii | 7.7% | 74.0% | 2.2% | 3.7 |
| Idaho | 0.0% | 98.3% | 1.0% | 0.0 |
| Illinois | 69.1% | 88.3% | 14.7% | 13.0 |
| Indiana | 59.8% | 81.9% | 10.3% | 13.0 |
| Iowa | 49.5% | 93.4% | 4.4% | 21.3 |
| Kansas | 43.8% | 90.2% | 6.2% | 11.8 |
| Kentucky | 43.9% | 100.0% | 8.7% | 8.2 |
| Louisiana | 79.1% | 90.0% | 32.8% | 7.8 |
| Maine | 12.9% | 99.2% | 2.0% | 7.3 |
| Maryland | 76.7% | 97.6% | 31.7% | 7.1 |
| Massachusetts | 41.7% | 95.0% | 9.5% | 6.8 |
| Michigan | 78.6% | 93.4% | 14.1% | 22.4 |
| Minnesota | 70.9% | 99.7% | 7.6% | 29.6 |
| Mississippi | 77.6% | 53.1% | 37.8% | 5.7 |
| Missouri | 71.3% | 94.7% | 11.7% | 18.7 |
| Montana | 7.0% | 99.7% | 0.6% | 12.5 |
| Nebraska | 47.9% | 67.1% | 5.4% | 16.1 |
| Nevada | 50.6% | 99.5% | 10.8% | 8.5 |
| New Hampshire | 13.8% | 86.4% | 2.0% | 7.8 |
| New Jersey | 60.0% | 93.2% | 15.4% | 8.2 |
| New Mexico | 10.4% | 85.9% | 2.7% | 4.2 |
| New York | 73.6% | 96.3% | 17.7% | 13.0 |
| North Carolina | 68.3% | 87.7% | 22.2% | 7.6 |
| North Dakota | 28.6% | 96.7% | 3.6% | 10.7 |
| Ohio | 72.0% | 87.5% | 13.3% | 16.8 |
| Oklahoma | 46.9% | 100.0% | 7.9% | 10.3 |
| Oregon | 20.9% | 98.1% | 2.3% | 11.2 |
| Pennsylvania | 60.6% | 93.0% | 12.2% | 11.1 |
| Rhode Island | 45.5% | 100.0% | 9.1% | 8.3 |
| South Carolina | 74.2% | 96.0% | 26.3% | 8.1 |
| South Dakota | 3.7% | 86.0% | 2.6% | 1.4 |
| Tennessee | 69.1% | 99.1% | 16.7% | 11.2 |
| Texas | 47.7% | 98.8% | 13.4% | 5.9 |
| Utah | 5.9% | 96.4% | 1.6% | 3.9 |
| Vermont | 46.2% | 100.0% | 1.5% | 56.4 |
| Virginia | 74.1% | 99.9% | 20.0% | 11.4 |
| Washington | 30.8% | 98.3% | 4.6% | 9.2 |
| West Virginia | 26.6% | 76.3% | 3.7% | 9.4 |
| Wisconsin | 65.6% | 97.1% | 6.6% | 27.0 |
| Wyoming | 0.0% | 88.2% | 1.2% | 0.0 |


Be the first to comment