
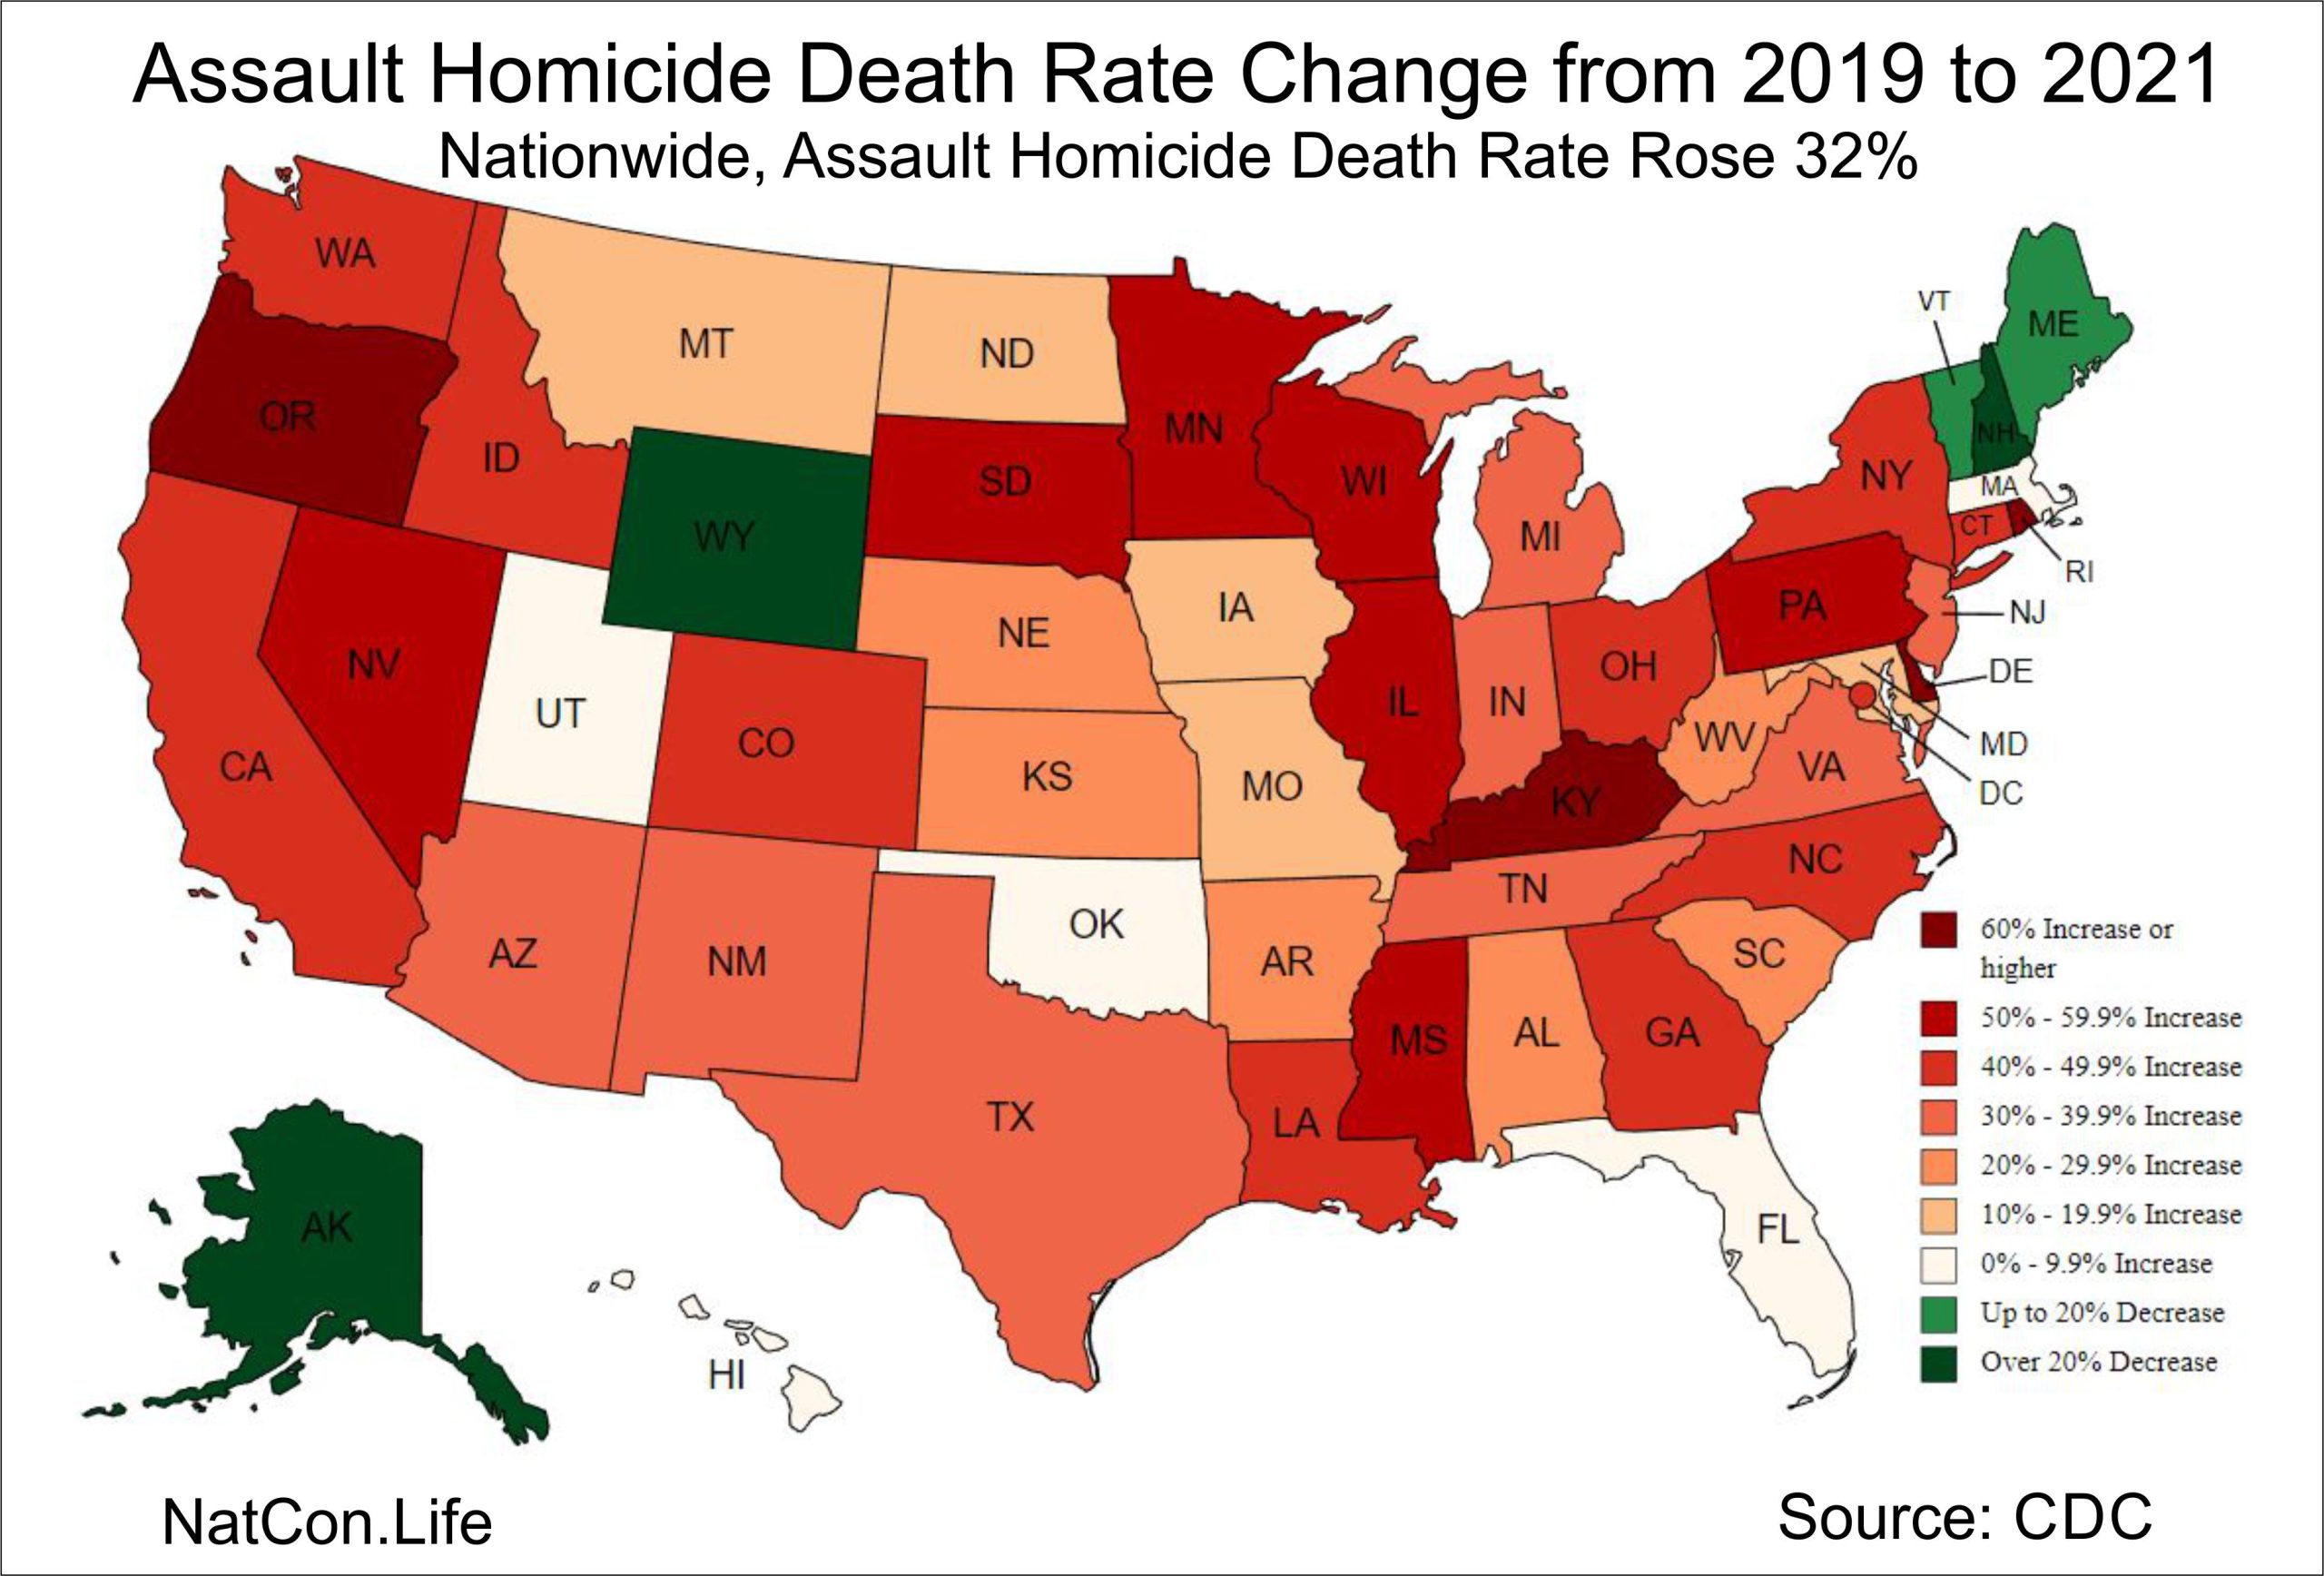
Click here to view a better image of the map:
Death totals and population figures are from the CDC Wonder Database. This is the death rate for “assault homicide.” Note that the number of assault homicides reported by the CDC is higher than official state “murder and non-negligent homicide” totals. This is because states are more strict about what they count. Many US cities and states have tightened their definition of “murder and non-negligent homicide” over the years to keep their official homicide rates as low as possible.
We find that the assault homicide total reported by the CDC for any given state in any given year is typically 15% higher than the official state total.
| State | 2019 Deaths | Population | Rate Per 100k | 2021 Deaths | Population | Rate Per 100k |
Change from 2019 to 2021
|
| Alabama (01) | 587 | 4,903,185 | 12 | 748 | 5,039,877 | 14.8 | 23.33% |
| Alaska (02) | 78 | 731,545 | 10.7 | 49 | 732,673 | 6.7 | -37.38% |
| Arizona (04) | 414 | 7,278,717 | 5.7 | 562 | 7,276,316 | 7.7 | 35.09% |
| Arkansas (05) | 270 | 3,017,804 | 8.9 | 335 | 3,025,891 | 11.1 | 24.72% |
| California (06) | 1,794 | 39,512,223 | 4.5 | 2,495 | 39,237,836 | 6.4 | 42.22% |
| Colorado (08) | 250 | 5,758,736 | 4.3 | 368 | 5,812,069 | 6.3 | 46.51% |
| Connecticut (09) | 106 | 3,565,287 | 3 | 160 | 3,605,597 | 4.4 | 46.67% |
| Delaware (10) | 53 | 973,764 | 5.4 | 103 | 1,003,384 | 10.3 | 90.74% |
| District of Columbia (11) | 162 | 705,749 | 23 | 223 | 670,050 | 33.3 | 44.78% |
| Florida (12) | 1,334 | 21,477,737 | 6.2 | 1,468 | 21,781,128 | 6.7 | 8.06% |
| Georgia (13) | 849 | 10,617,423 | 8 | 1,206 | 10,799,566 | 11.2 | 40.00% |
| Hawaii (15) | 35 | 1,415,872 | 2.5 | 39 | 1,441,553 | 2.7 | 8.00% |
| Idaho (16) | 27 | 1,787,065 | 1.5 | 41 | 1,900,923 | 2.2 | 46.67% |
| Illinois (17) | 979 | 12,671,821 | 7.7 | 1,487 | 12,671,469 | 11.7 | 51.95% |
| Indiana (18) | 466 | 6,732,219 | 6.9 | 624 | 6,805,985 | 9.2 | 33.33% |
| Iowa (19) | 80 | 3,155,070 | 2.5 | 94 | 3,193,079 | 2.9 | 16.00% |
| Kansas (20) | 137 | 2,913,314 | 4.7 | 180 | 2,934,582 | 6.1 | 29.79% |
| Kentucky (21) | 250 | 4,467,673 | 5.6 | 408 | 4,509,394 | 9 | 60.71% |
| Louisiana (22) | 650 | 4,648,794 | 14 | 943 | 4,624,047 | 20.4 | 45.71% |
| Maine (23) | 23 | 1,344,212 | 1.7 | 20 | 1,372,247 | 1.5 | -11.76% |
| Maryland (24) | 578 | 6,045,680 | 9.6 | 709 | 6,165,129 | 11.5 | 19.79% |
| Massachusetts (25) | 157 | 6,892,503 | 2.3 | 160 | 6,984,723 | 2.3 | 0.00% |
| Michigan (26) | 612 | 9,986,857 | 6.1 | 822 | 10,050,811 | 8.2 | 34.43% |
| Minnesota (27) | 154 | 5,639,632 | 2.7 | 232 | 5,707,390 | 4.1 | 51.85% |
| Mississippi (28) | 434 | 2,976,149 | 14.6 | 656 | 2,949,965 | 22.2 | 52.05% |
| Missouri (29) | 628 | 6,137,428 | 10.2 | 716 | 6,168,187 | 11.6 | 13.73% |
| Montana (30) | 39 | 1,068,778 | 3.6 | 46 | 1,104,271 | 4.2 | 16.67% |
| Nebraska (31) | 58.000 | 1934408.000 | 3 | 70 | 1,963,692 | 3.6 | 20.00% |
| Nevada (32) | 166.000 | 3080156 | 5.4 | 264 | 3,143,991 | 8.4 | 55.56% |
| New Hampshire (33) | 38.000 | 1359711 | 2.8 | 15 | 1,388,992 | 1.1 | -60.71% |
| New Jersey (34) | 287.000 | 8882190 | 3.2 | 409 | 9,267,130 | 4.4 | 37.50% |
| New Mexico (35) | 230.000 | 2096829 | 11 | 306 | 2,115,877 | 14.5 | 31.82% |
| New York (36) | 601.000 | 19453561 | 3.1 | 918 | 19,835,913 | 4.6 | 48.39% |
| North Carolina (37) | 707.000 | 10488084 | 6.7 | 991 | 10,551,162 | 9.4 | 40.30% |
| North Dakota (38) | 21.000 | 762062 | 2.8 | 24 | 774,948 | 3.1 | 10.71% |
| Ohio (39) | 724.000 | 11689100 | 6.2 | 1,020 | 11,780,017 | 8.7 | 40.32% |
| Oklahoma (40) | 333.000 | 3956971 | 8.4 | 342 | 3,986,639 | 8.6 | 2.38% |
| Oregon (41) | 126.000 | 4217737 | 3 | 204 | 4,246,155 | 4.8 | 60.00% |
| Pennsylvania (42) | 722.000 | 12801989 | 5.6 | 1,101 | 12,964,056 | 8.5 | 51.79% |
| Rhode Island (44) | 23.000 | 1059361 | 2.2 | 40 | 1,095,610 | 3.7 | 68.18% |
| South Carolina (45) | 527.000 | 5148714 | 10.2 | 656 | 5,190,705 | 12.6 | 23.53% |
| South Dakota (46) | 29.000 | 884659 | 3.3 | 45 | 895,376 | 5 | 51.52% |
| Tennessee (47) | 596.000 | 6829174 | 8.7 | 810 | 6,975,218 | 11.6 | 33.33% |
| Texas (48) | 1694.000 | 28995881 | 5.8 | 2,391 | 29,527,941 | 8.1 | 39.66% |
| Utah (49) | 82.000 | 3205958 | 2.6 | 91 | 3,337,975 | 2.7 | 3.85% |
| Vermont (50) | 11.000 | 623989 | 1.8 | 10 | 645,570 | 1.5 | -16.67% |
| Virginia (51) | 436.000 | 8535519 | 5.1 | 606 | 8,642,274 | 7 | 37.25% |
| Washington (53) | 241.000 | 7614893 | 3.2 | 346 | 7,738,692 | 4.5 | 40.63% |
| West Virginia (54) | 92.000 | 1792147 | 5.1 | 114 | 1,782,959 | 6.4 | 25.49% |
| Wisconsin (55) | 226.000 | 5822434 | 3.9 | 348 | 5,895,908 | 5.9 | 51.28% |
| Wyoming (56) | 25.000 | 578759 | 4.3 | 16 | 578,803 | 2.8 | -34.88% |


Be the first to comment