
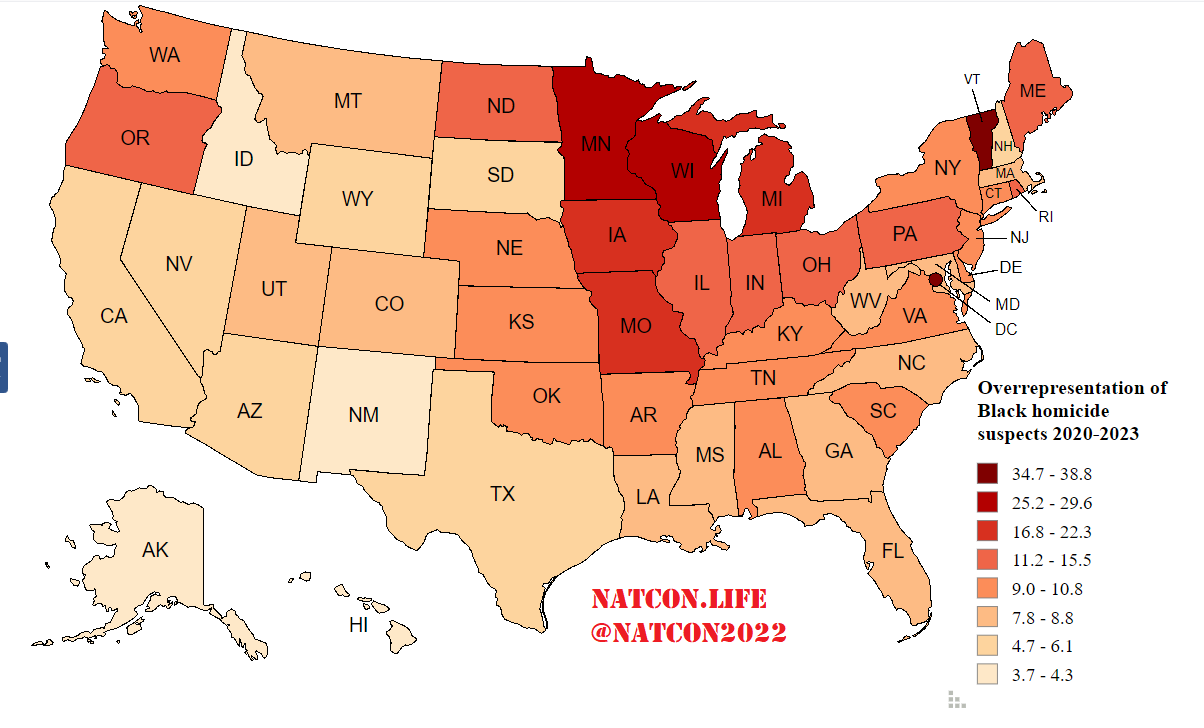
We used a four year period so account for single year anomalies. The data is for 2020-2023.
The average Black overrepresentation was 11.3. In other words, Blacks are being charged with homicide at 11.3 times the combined rate of all other races within the same state.
Click here to see a large picture of the chart.
| Overall Black % | Black % of Suspects (20-23) | Black Overrepresentation | |
| DC | 47.2% | 97.2% | 38.8 |
| Vermont | 1.5% | 34.6% | 34.7 |
| Minnesota | 7.6% | 70.9% | 29.6 |
| Wisconsin | 6.6% | 64.0% | 25.2 |
| Iowa | 4.4% | 50.6% | 22.3 |
| Michigan | 14.1% | 76.1% | 19.4 |
| Missouri | 11.7% | 69.0% | 16.8 |
| Illinois | 14.7% | 72.8% | 15.5 |
| Maine | 2.0% | 23.8% | 15.3 |
| Pennsylvania | 12.2% | 66.8% | 14.5 |
| Ohio | 13.3% | 68.3% | 14.0 |
| Indiana | 10.3% | 60.9% | 13.6 |
| North Dakota | 3.6% | 32.5% | 12.9 |
| Oregon | 2.3% | 22.9% | 12.6 |
| Rhode Island | 9.1% | 52.8% | 11.2 |
| Nebraska | 5.4% | 38.1% | 10.8 |
| New Jersey | 15.4% | 65.9% | 10.6 |
| Tennessee | 16.7% | 67.5% | 10.4 |
| Kansas | 6.2% | 40.4% | 10.3 |
| New York | 17.7% | 68.8% | 10.3 |
| Delaware | 23.8% | 75.8% | 10.0 |
| Virginia | 20.0% | 70.9% | 9.7 |
| Arkansas | 15.6% | 64.3% | 9.7 |
| Oklahoma | 7.9% | 45.4% | 9.7 |
| South Carolina | 26.3% | 77.5% | 9.7 |
| Alabama | 26.8% | 77.8% | 9.6 |
| Washington | 4.6% | 30.5% | 9.1 |
| Connecticut | 12.9% | 57.3% | 9.1 |
| Kentucky | 8.7% | 46.2% | 9.0 |
| Maryland | 31.7% | 80.3% | 8.8 |
| Montana | 0.6% | 5.0% | 8.7 |
| Louisiana | 32.8% | 80.9% | 8.7 |
| North Carolina | 22.2% | 71.2% | 8.7 |
| Georgia | 33.1% | 80.8% | 8.5 |
| Utah | 1.6% | 12.0% | 8.4 |
| West Virginia | 3.7% | 23.9% | 8.2 |
| Massachusetts | 9.5% | 45.8% | 8.0 |
| Mississippi | 37.8% | 82.9% | 8.0 |
| Florida | 17.0% | 61.7% | 7.9 |
| Colorado | 4.7% | 27.8% | 7.8 |
| Texas | 13.4% | 48.7% | 6.1 |
| South Dakota | 2.6% | 13.8% | 6.0 |
| California | 6.5% | 29.1% | 5.9 |
| Nevada | 10.8% | 41.2% | 5.8 |
| Arizona | 5.5% | 25.1% | 5.8 |
| Wyoming | 1.2% | 5.5% | 4.8 |
| New Hampshire | 2.0% | 8.8% | 4.7 |
| New Mexico | 2.7% | 10.6% | 4.3 |
| Hawaii | 2.2% | 8.7% | 4.2 |
| Alaska | 3.7% | 12.8% | 3.8 |
| Idaho | 1.0% | 3.6% | 3.7 |


Be the first to comment